There’s a world of difference between Power BI dashboards that look impressive and ones that actually change how you run your business. The pretty ones get admired in meetings, but truly effective Power BI dashboard creation focuses on solutions that are regularly monitored because they genuinely influence what happens next.
The distinction matters more than you might think. Most business intelligence solutions fail not because the data is wrong or the charts are ugly, but because they don’t connect the dots between information and action. They tell you what happened, but they don’t help you decide what to do about it.
The most powerful custom Power BI dashboards share a common trait: they answer the questions that keep business owners awake at 3am. Not the questions they think they should be asking, but the ones that genuinely matter for their specific situation.
Consider a manufacturing business struggling with cash flow despite strong sales figures. Traditional Excel reports might show revenue trends and expense categories, but effective Power BI dashboard creation focuses on what they really need to see—the gap between when they invoice clients and when payments actually hit the bank. Custom reporting solutions showing aging receivables alongside cash flow projections help spot potential shortfalls weeks in advance, enabling action before problems become crises.
That’s the difference between basic reporting and comprehensive business intelligence solutions. Reporting tells you that your receivables are $150,000. Well-designed dashboards tell you that based on current aging patterns; you’ll be $30,000 short of covering next month’s payroll unless you chase three specific overdue invoices this week.
Human beings are remarkably good at ignoring information that doesn’t lead to clear action. It’s not laziness—it’s cognitive efficiency. When faced with pages of charts and tables, most business managers will glance at the headlines and move on to something they can actually do something about.
This is why professional Power BI services focus ruthlessly on decision points rather than data points. Instead of showing every possible metric, effective data visualisation tools highlight specific information that should trigger specific responses. Revenue down 15% this month? Well-designed business intelligence solutions don’t just show the decline—they break down which products, customers, or regions are driving the drop, giving you somewhere concrete to start investigating.
The best custom Power BI dashboards also understand timing. There’s no point alerting someone to a problem they can’t solve until next week, but there’s enormous value in highlighting issues that need attention right now. This is where automated alerts and exception reporting become powerful—not because they eliminate human judgment, but because they focus it on the decisions that matter most.
Visual appeal matters, but not for the reasons most people think. Well-designed reporting solutions aren’t effective because they look good—they’re effective because they make complex information instantly understandable. The goal isn’t to impress visitors in the boardroom; it’s to help busy managers make better decisions faster.
Effective Power BI dashboard creation follows the way people actually consume information under pressure. The most critical metrics need to be visible at a glance, ideally with clear indicators of whether things are tracking well or need attention. Detailed information should be available but not overwhelming—accessible through drilling down rather than cluttering the main view.
Context is everything in business intelligence solutions. Showing this month’s sales figure is interesting. Showing this month’s sales compared to target, last month, and the same month last year starts to tell a story. Adding trends, seasonal patterns, and leading indicators transforms data into insight.
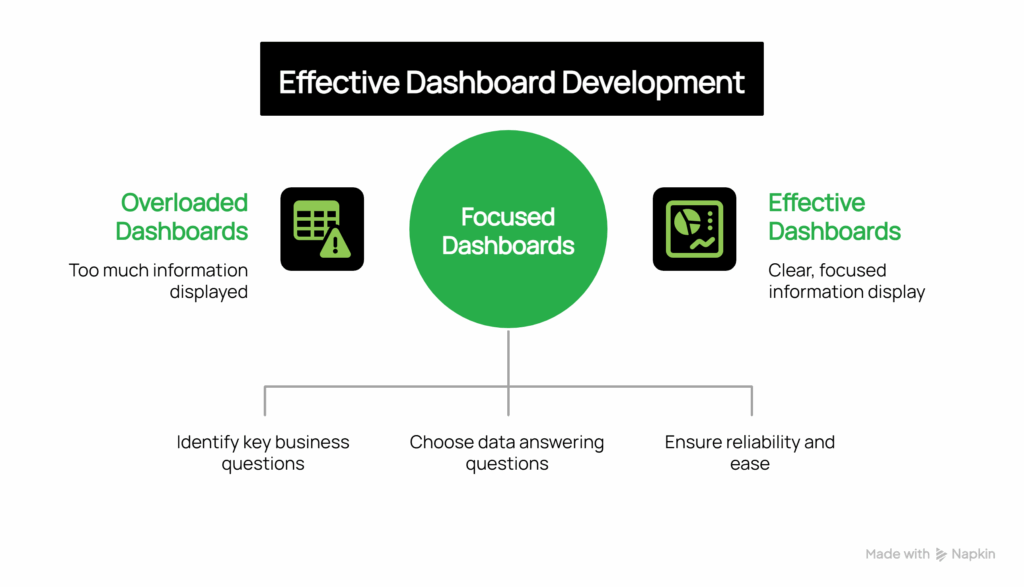
The most common mistake in dashboard development is trying to put everything on one screen. The “single pane of glass” approach sounds logical until you realise that different decisions require different information. A sales manager needs to see pipeline health and conversion rates. A CFO needs cash flow and profitability trends. An operations manager needs capacity utilisation and quality metrics. Custom solutions trying to serve all these needs end up serving none of them well.
Don’t fall into the trap of building data visualisation tools around the data you have rather than the decisions you need to make. Just because your CRM captures 47 different fields doesn’t mean they all belong on your sales dashboard. The most professional Power BI services start with an important business question—”Are we on track to hit our quarterly target?”—then work backwards to identify which specific data points help answer that question.
Technical complexity can also undermine effectiveness. Reporting solutions that take forever to load, require special training to interpret, or break every time someone updates the underlying data quickly become abandoned. The most successful business intelligence solutions prioritise reliability and simplicity over sophistication.
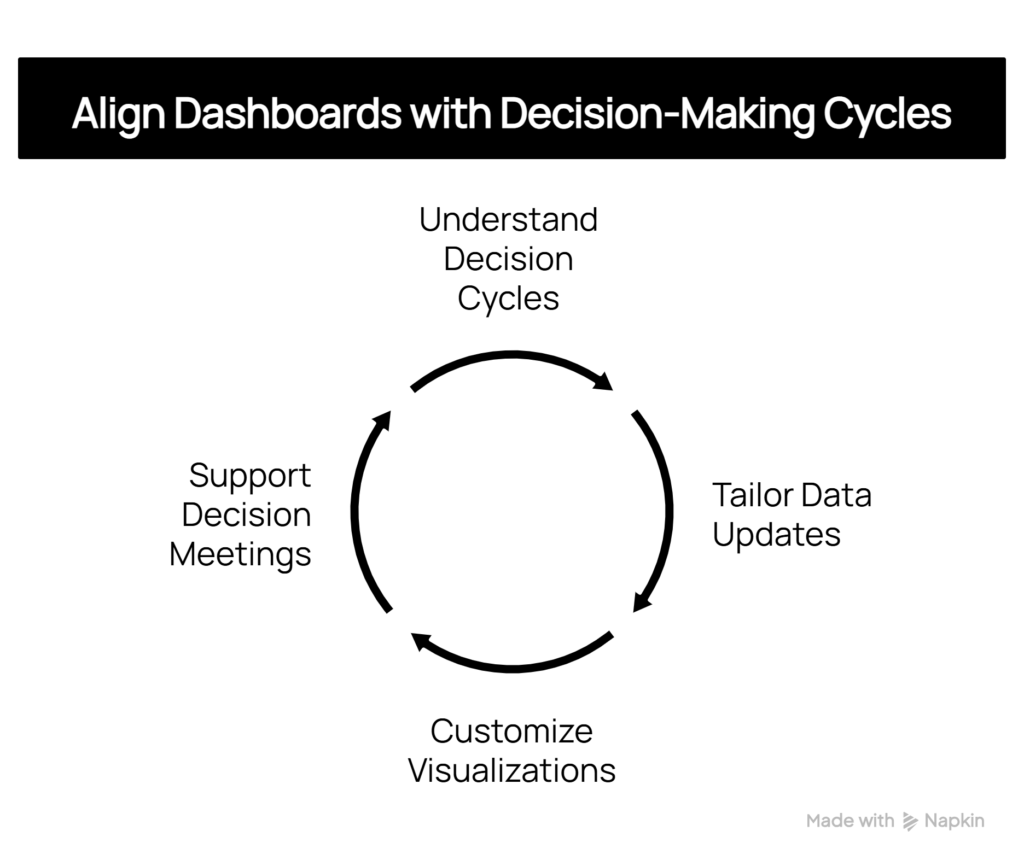
Decision-making cycles vary across businesses, and effective dashboard development should reflect these patterns. A retail business might require daily inventory updates but only weekly sales trend analysis. A professional services firm might focus on monthly utilisation rates while needing real-time project status updates.
The key is understanding how and when decisions are made within your organisation. If your management team meets every Tuesday morning to review performance, your reporting solutions should support that cycle—with data that’s current as of Monday night and focused on issues that can be addressed in the coming week.
Likewise, individual managers need custom data visualisation tools that align with their daily workflow. A warehouse manager checking stock levels at 6am needs different information, presented differently, than a marketing director reviewing campaign performance during afternoon planning sessions.
When Power BI dashboards are designed around decision-making rather than data display, they start to change how businesses operate. Managers become more proactive because they can spot trends early. Teams become more aligned because everyone’s looking at the same key metrics. Strategic planning becomes more grounded because it’s based on clear, current information rather than gut feel and outdated reports.
Perhaps most importantly, effective business intelligence solutions help businesses learn about themselves. Patterns emerge that weren’t visible in traditional reporting. Correlations become apparent between seemingly unrelated activities. Over time, this deeper understanding leads to better strategy and more confident decision-making.
The transformation isn’t just about having better information—it’s about developing a more systematic, evidence-based approach to running the business through professional Power BI dashboard creation.
Ready to explore how custom Power BI dashboards could transform decision-making in your business? Our consulting services specialise in creating intelligent solutions that connect data to action, helping Australian businesses make faster, better-informed decisions.
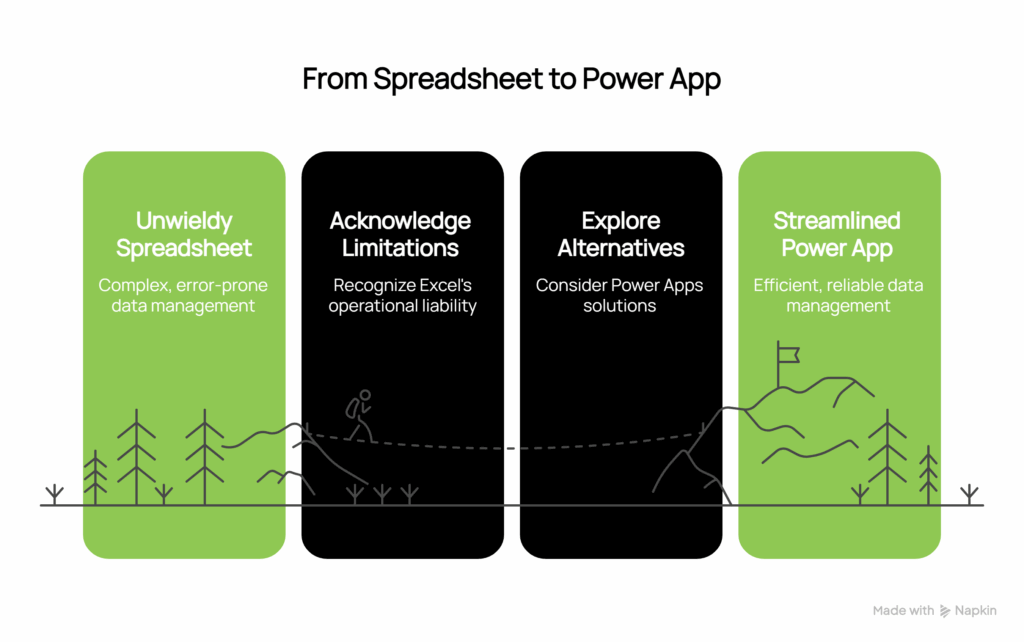
Every Australian business has at least one Excel spreadsheet that started innocently enough—a simple way to track something important. Fast forward twelve months, and that same spreadsheet has become a business-critical monster with multiple tabs, complex formulas, and three different people trying to update it simultaneously. When someone accidentally deletes a column or overwrites crucial data, the entire operation grinds to a halt.
This evolution from helpful tool to operational liability happens gradually, which is why many business owners don’t realise when Excel has outlived its usefulness. The moment you find yourself saying “don’t touch that spreadsheet—it runs the business,” it’s time to consider Power Apps Excel replacement solutions.
Excel performs exceptionally well at calculations and data analysis, but it becomes problematic when treated as a business application. The issues compound as your business grows and more people need access to critical information stored in shared spreadsheets.
Version control becomes chaotic when multiple copies float around with different data, making it impossible to know which version is correct. Data corruption risks escalate dramatically—one wrong click can destroy months of carefully maintained information with no easy recovery option. Access limitations prevent field staff from easily updating information from mobile devices, creating delays and data gaps that impact real-time decision making.
Manual process bottlenecks emerge when simple tasks like approvals require emailing spreadsheets back and forth through multiple people. Perhaps most concerning is the complete absence of audit trails—there’s no way to track who changed what information when, creating compliance and accountability issues that can expose your business to significant risk.
The solution isn’t to find better ways to manage Excel—it’s to replace Excel with purpose-built applications that handle multi-user business processes properly.
Employee Directory and Contact Management transforms that shared Excel file containing everyone’s contact details, emergency contacts, and skills information. A well-designed employee directory provides searchable interfaces, photo integration, and role-based access without the constant version conflicts that plague shared spreadsheets. Teams can quickly locate colleagues, understand reporting structures, and access essential contact information without navigating complex spreadsheet tabs.
Equipment and Asset Tracking converts your equipment maintenance spreadsheet into a mobile-friendly asset management system. Modern asset tracking incorporates barcode scanning, maintenance scheduling, and condition reporting that updates in real-time rather than waiting for someone to manually update Excel rows back at the office. Maintenance teams can log issues immediately, schedule preventive maintenance automatically, and generate reports that provide genuine insights into asset performance.
Leave Request and Approval Systems replace the holiday tracking spreadsheet that requires manual calendar updates and email chains for approvals. Automated workflow systems allow staff to submit requests through mobile apps, enable managers to approve with automatic notifications, and update calendars without manual intervention. This eliminates the confusion of overlapping leave requests and ensures adequate coverage planning.
Incident and Safety Reporting converts safety incident logs or customer complaint tracking from Excel into structured reporting systems. These applications include photo attachments, automatic notification workflows, and follow-up task creation that ensures nothing falls through the cracks. Management gains visibility into patterns and trends that might be hidden in spreadsheet rows, enabling proactive responses to emerging issues.
Expense Tracking and Approval ends the monthly ritual of collecting expense spreadsheets from different team members. Modern expense systems feature receipt photo capture, automatic approval routing based on amounts and categories, and direct integration with your accounting software. This streamlines reimbursement processes while providing better visibility into spending patterns and budget compliance.
When businesses transition from Excel to proper Power Apps solutions, the transformation goes beyond just replacing spreadsheets. These applications provide capabilities that Excel simply cannot match in multi-user business environments.
Real-time collaboration allows multiple users to update information simultaneously without conflicts or data corruption. Mobile accessibility ensures field staff and remote workers can access and update critical information from anywhere, supporting the flexible work arrangements that modern businesses require. Automated workflows handle approval processes, notifications, and task creation based on business rules, reducing administrative overhead while improving consistency.
Data integrity features include built-in validation that prevents common data entry errors and maintains consistency across all records. Comprehensive audit capabilities provide complete history tracking of who changed what information and when, supporting compliance requirements and accountability frameworks that are increasingly important in regulated industries.
Perhaps most importantly, these solutions scale with your business growth rather than becoming more problematic as you add users and complexity. While Excel becomes exponentially more difficult to manage with additional users and data volume, properly designed Power Apps maintain performance and usability regardless of scale.
While the concept of replacing Excel spreadsheets with Power Apps might sound straightforward, proper implementation requires understanding of data architecture, user experience design, and business workflow optimisation. The difference between a basic app and one that truly transforms your operations lies in the details of how information flows between systems and users.
Professional development services ensure that your new applications integrate seamlessly with existing business systems, provide intuitive user experiences that encourage adoption, and include the robust error handling and security measures that business-critical applications require. The technical complexity of building reliable, scalable business applications means that while the end result appears simple, the underlying development requires expertise in database design, user interface optimisation, and business process automation.
The investment in professional development pays dividends through reduced training requirements, higher user adoption rates, and applications that continue to serve your business effectively as requirements evolve. Rather than creating another system that becomes problematic over time, proper planning and implementation create foundations that support long-term business growth.
Ready to replace problematic Excel spreadsheets with professional Power Apps solutions? Our Power Apps development services specialise in creating simple, powerful business applications that eliminate spreadsheet chaos while integrating seamlessly with your existing systems.
Most Australian business owners spend their days jumping between different systems to understand what’s really happening in their company. You check Xero to see how the finances are tracking, hop into HubSpot to look at the sales pipeline, flick over to Shopify for e-commerce stats, then open Google Analytics to check website traffic. By the time you’ve pieced it all together, an hour’s gone—and you still don’t have the full story.
This fragmented approach to business intelligence isn’t just inefficient—it’s dangerous. When your critical business data lives in isolated silos, you’re making decisions with incomplete information. The solution isn’t to find better individual reports from each system, but to bring all that data together in one place where it can tell the complete story of your business.
Power BI integration with your existing business systems transforms scattered data points into strategic insights. But not all integrations deliver equal value. Here are the five essential data sources that Australian businesses should prioritise when building their business intelligence ecosystem.
Xero dominates the Australian accounting software market for good reason—it handles everything from invoicing to payroll with remarkable efficiency. But where Xero truly shines in a Power BI environment is providing the financial context that transforms all your other business metrics from interesting to actionable.
When Power BI connects to your Xero data, you’re not just getting another way to view profit and loss statements. You’re creating the foundation for understanding whether your marketing spend is actually profitable, which customer segments drive the best margins, and how seasonal trends affect your cash flow. More importantly, you can see these insights in real-time rather than waiting for month-end reports.
The real power emerges when Xero financial data combines with information from your other business systems. Suddenly you can answer questions like “Which marketing campaigns deliver customers who actually pay their invoices on time?” or “How do our e-commerce profit margins compare to traditional sales channels?” These insights are impossible when your financial data stays trapped in accounting software.
Many Australian businesses already use Microsoft 365, making SharePoint a natural choice for storing operational data that doesn’t fit neatly into specialised software. Project timelines, inventory tracking, customer service records, and team performance metrics often live in SharePoint lists or shared Excel files.
The beauty of connecting SharePoint to Power BI lies in its flexibility. Unlike rigid database systems, SharePoint adapts to how your business actually works. Need to track project milestones? SharePoint handles it. Want to monitor equipment maintenance schedules? SharePoint works. Require a simple CRM for smaller clients who don’t warrant full HubSpot records? SharePoint delivers.
When this operational data flows into Power BI dashboards, it provides crucial context for understanding your business performance. You can correlate project delivery timelines with customer satisfaction scores or identify which operational bottlenecks impact financial results. This integration turns administrative data into strategic intelligence.
For growing Australian businesses, HubSpot has become the CRM of choice because it scales from simple contact management to sophisticated marketing automation. The platform captures everything from initial lead sources to final deal closure, creating a comprehensive record of your sales and marketing activities.
Connecting HubSpot to Power BI transforms this sales data from historical reporting into predictive intelligence. Instead of just knowing how many leads you generated last month, you can forecast revenue based on current pipeline health, identify which lead sources convert to actual customers, and spot early warning signs when deals are likely to stall.
The integration becomes particularly powerful for Australian businesses operating across multiple channels or locations. You can compare performance between different sales teams, understand regional variations in customer behavior, and identify the marketing activities that actually drive qualified leads rather than just website visits.
Australian businesses increasingly operate hybrid models combining traditional sales with e-commerce platforms. Shopify has captured a significant portion of this market by making online selling accessible to businesses that previously relied solely on physical locations or direct sales.
Power BI integration with Shopify data reveals patterns that individual platform reports miss entirely. You can identify which products perform better online versus in-store, understand how seasonal trends differ between sales channels, and spot opportunities to optimise inventory across both physical and digital locations.
The real value emerges when Shopify data combines with your financial information from Xero. You can calculate true profitability by channel, understand the complete customer acquisition cost including shipping and processing fees, and make informed decisions about where to focus your growth efforts.
Every Australian business with a website uses Google Analytics, but most barely scratch the surface of its insights. The platform captures detailed information about how potential customers discover your business, what they do on your website, and which content actually drives meaningful engagement.
When Google Analytics data flows into Power BI alongside your sales and financial information, it completes the customer journey picture. You can trace which marketing channels not only drive traffic but actually convert to paying customers. More importantly, you can calculate the true return on investment for your digital marketing efforts by connecting website behaviour to actual revenue.
This integration helps Australian businesses understand their digital presence beyond vanity metrics. Page views are interesting, but conversion rates that correlate with profitable customer acquisition are actionable intelligence.
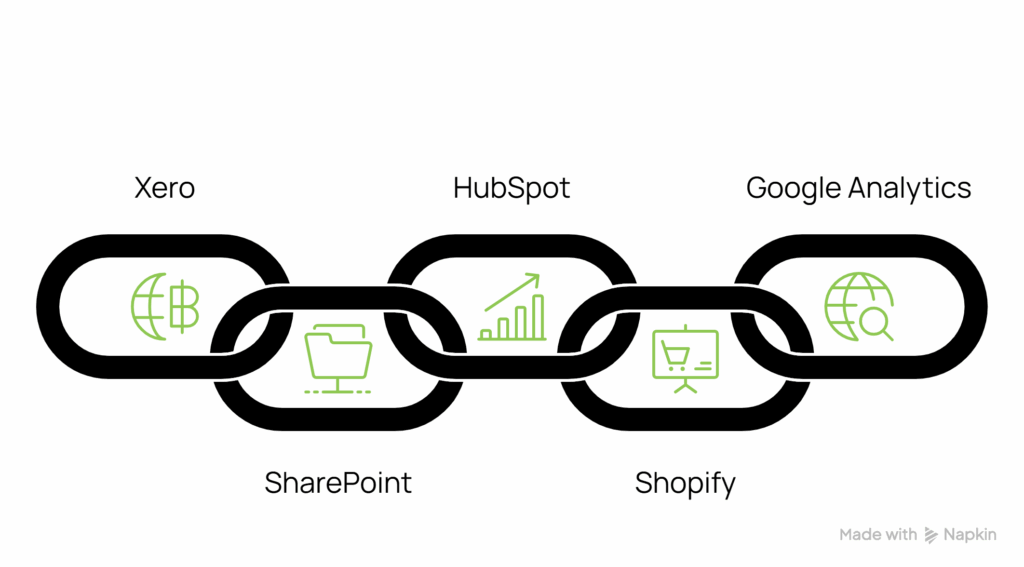
These five data sources work together to create a comprehensive view of your business operations. Financial performance from Xero provides the baseline. SharePoint adds operational context. HubSpot contributes sales intelligence. Shopify delivers e-commerce insights. Google Analytics completes the customer journey picture.
The technical complexity of connecting these systems, ensuring data accuracy, and building reliable dashboards can be high. But the business value of having all your critical information in one place—updating automatically and revealing patterns you’d never spot manually—justifies the investment.
When your business data works together instead of in isolation, you stop making decisions based on partial information and start operating with complete intelligence.
Ready to connect your business systems and gain complete visibility into your operations? We specialise in Power BI integration with Xero, HubSpot, Shopify, and other essential business platforms, helping Australian companies transform scattered data into strategic insights.
Picture this: your best field technician finishes a complex equipment inspection, spends thirty minutes filling out compliance paperwork in their truck, drives back to the office, and hands the forms to admin staff for data entry. Three days later, when the equipment actually fails, you discover the critical warning signs were buried in a stack of unprocessed paperwork on someone’s desk.
This scenario plays out across Australian businesses every day, from construction companies tracking safety inspections to service businesses managing customer visits. The information that could prevent problems, improve efficiency, or ensure compliance gets trapped in a paper-based bottleneck that transforms valuable field intelligence into administrative burden. Power Apps offers a proven solution to eliminate these inefficiencies.
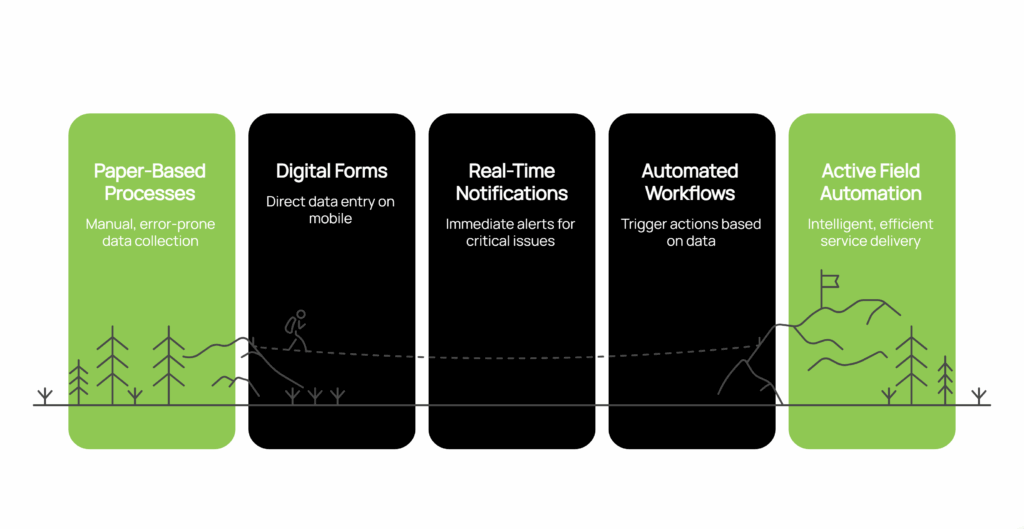
Power Apps transforms field data collection by eliminating the gap between observation and action. Custom mobile solutions replace paper-based processes, enabling field staff to enter information directly into digital forms that immediately become available to the people who need to act on it.
The transformation delivers measurable business improvements:
The real power emerges through intelligent workflows that transform data collection from passive documentation into active field service automation. When a field inspection identifies a safety hazard, the system immediately notifies supervisors, generates work orders for remediation, and flags related equipment for monitoring.
Construction companies use Power Apps for safety inspections that automatically generate compliance reports while creating photographic evidence of site conditions. When inspectors identify potential hazards, the system immediately alerts project managers and creates corrective action tasks with deadlines and responsibility assignments.
Equipment maintenance teams leverage mobile data collection for asset condition tracking that triggers predictive maintenance workflows. Field technicians scanning equipment barcodes can instantly access maintenance histories, update condition assessments, and automatically generate parts orders when wear indicators reach threshold levels.
Service businesses capture customer interaction data that flows directly into billing systems. Job completion forms with customer signatures automatically generate invoices, trigger follow-up communications, and update service histories without requiring office staff to process paperwork.
Power Apps field data collection creates competitive advantages that extend far beyond operational efficiency improvements. Real-time visibility into field operations enables better resource allocation, faster problem resolution, and more accurate job costing. Management dashboards displaying current field activities help business owners make informed decisions about priorities and resource deployment.
Compliance management becomes systematic rather than reactive when Power Apps digital forms enforce mandatory completion and automatically generate audit trails. Customer satisfaction improves when field data flows immediately into customer service systems, enabling faster response times and more professional digital processes.
The technical complexity of building effective mobile data collection systems, ensuring reliable offline functionality, and integrating with existing business systems requires working with an experienced Power Apps consultant. However, the business benefits of eliminating paper-based field processes typically deliver return on investment within months rather than years.
When field staff can focus on their core expertise instead of administrative tasks, and when critical information becomes available in real-time rather than after processing delays, the entire business operates more efficiently and effectively.
Ready to transform how your field teams collect and share critical business information? Our mobile app development services specialise in Power Apps solutions that eliminate paper-based processes, enabling real-time field data collection that integrates seamlessly with your existing business systems. Contact us to explore how Power Apps can revolutionise your field operations.
Excel has been the backbone of business reporting for decades, and honestly, it’s brilliant at what it does. Most growing businesses start their reporting journey there, and for good reason—it’s familiar, flexible, and everyone knows how to use it.
But here’s the thing: Excel reporting can quietly become your biggest productivity drain without you even realising it. After helping businesses with their technology for almost 20 years, We’ve seen this pattern play out countless times. What starts as a simple monthly report gradually evolves into a complex web of spreadsheets that consumes hours of valuable time each month.
Don’t get me wrong—Excel isn’t the enemy here. We still see plenty of situations where it’s absolutely the right tool for the job. Take those quarterly board reports or annual summaries, for instance. If you’re pulling together information that doesn’t change frequently and you’re comfortable with the manual process, Excel handles this beautifully.
Similarly, if you’re working with smaller datasets—maybe hundreds or a few thousand rows—Excel manages this without breaking a sweat. And when you need to quickly analyse a specific problem or dive into a one-off investigation, Excel’s flexibility makes it perfect for that kind of exploratory work.
The sweet spot for Excel remains those static reports that don’t change much and where you’re genuinely happy updating them manually each period. There’s nothing wrong with this approach if it’s working for your business.
But there’s usually a moment when businesses realise their Excel reporting has quietly taken on a life of its own. We call it “spreadsheet archaeology”— hunting through different versions to find the “final final FINAL” report.
Or maybe you’ve noticed that preparing your monthly reports now takes an entire day instead of the hour it used to take. You’re copying and pasting data from your CRM, then your accounting system, then that other database, and by the time you’re finished, you’re already thinking about how you’ll need to do it all again next month.
The real wake-up call often comes when a key person goes on holiday and suddenly no one else knows how to update the reports. I’ve seen businesses scramble for weeks.
More troubling is when data accuracy becomes a guessing game. Different report versions tell different stories because they were created at different times using different sources. Management meetings become exercises in figuring out which numbers are correct.
Another common frustration is when your reports start hitting Excel’s performance limits. Files that take forever to open, constant crashes when you try to refresh data, or worse—losing work because the file corrupted. These aren’t just minor inconveniences; they’re signals that you’ve outgrown what spreadsheet-based reporting can reliably deliver.
Power BI isn’t about creating prettier reports, though they certainly look more professional. It’s about solving these very real business problems that Excel reporting creates as you grow.
The biggest transformation comes from connecting your reports directly to your data sources. Instead of manually gathering information from your CRM, accounting system, and various databases each month, Power BI pulls this data automatically. That monthly day of preparation becomes a few minutes of reviewing updated dashboards that refresh themselves.
This automation means you’re always working with current data rather than month-old snapshots. When a potential customer asks about your latest performance metrics, or when you need to make a quick decision based on recent trends, the information is already there, reflecting what’s actually happening in your business right now.
The consistency factor can’t be overstated either. When everyone in the business is working from the same data source, those frustrating “which version is correct?” conversations disappear. Your sales manager, operations team, and financial controller are all looking at the same numbers, updated at the same time, eliminating confusion and building confidence in your business intelligence.
Power BI also handles much larger datasets without Excel’s performance issues. Reports stay fast and responsive as your data grows, with no corruption risks.
The clearest indicator that Excel reporting has become counterproductive is when data preparation consumes more time than data analysis. Australian businesses typically reach this tipping point when they’re spending several hours each month just gathering and formatting data before meaningful analysis can begin. Other warning signs include team members working with different versions of the same report, creating compliance risks around data accuracy, and critical business intelligence depending on one person’s Excel expertise.
The beauty of working with experienced professionals is that you don’t need to worry about learning new software or managing the technical complexity. We handle the entire transition process, from connecting your data sources to building the dashboards that will replace your current Excel reports.
The process typically starts with understanding your current reporting needs and pain points. We’ll look at your existing Excel reports, identify which data sources they draw from, and design Power BI solutions that not only replicate what you have but enhance it with real-time updates and better visualisation.
Most businesses are surprised at how quickly they see results. Within a few weeks, what used to be a day-long monthly reporting exercise becomes a quick review of automatically updated dashboards. The time savings alone usually justify the investment, but the improved accuracy and timeliness of information often proves even more valuable for decision-making.
Your time is valuable, and business intelligence solutions should accelerate decision-making, not hinder it. If monthly reporting is a burden rather than providing valuable insights, automated dashboards and data visualisation tools offer a proven path forward.
The transformation from manual Excel processes to automated Power BI reporting typically delivers measurable ROI within 90 days for Australian businesses. When spreadsheet archaeology becomes a monthly ritual, that’s technology working against your business growth rather than enabling it.
Ready to explore automated reporting solutions for your business? We help Australian businesses transition from Excel to Power BI dashboards, handling the technical complexity while you focus on using better business intelligence for growth.
Power Automate is a tool for automating repetitive and time-consuming tasks. As part of the Microsoft Power Platform, it can integrate quickly and easily into other Microsoft apps such as SharePoint and Outlook but can just as easily integrate with hundreds of non-Microsoft apps using an extensive collection of third-party and custom connectors. Even older legacy apps can be automated using a feature called Robotic Process Automation.
Power Automate is designed to automate repetitive and time-consuming business tasks. Not only does every organisation already have a plethora of these tasks being actioned manually every day, but there are often numerous business opportunities that are simply never pursued due to the perceived complexity and expense of the manual processes that would be required.
Handling these tasks manually is not only an expensive approach but can also introduce significant time delays and potential for human error. By automating these tasks, you can not only move staff onto more fulfilling and valuable activities, but also enjoy having the tasks done almost instantly and with perfect consistency.
Discovering new levels of efficiency with automation can be game changing, however the true value of Power Automate is in its ability to integrate multiple apps and systems together into a single unified and automated workflow. You no longer need to be constrained to the functionality built into a single app but can instead pull together the features and functionality of multiple apps and tie them all together using Power Automate. When used in this way the resulting process or workflow can truly be greater than the sum of its parts.
Any computer-based process is a potential candidate for automation, especially those that use modern apps and cloud services such as Microsoft 365. Some examples of simple process automation are:
Far more complex business processes and workflows are also candidates for automation, using some of the more advanced functionality of Power Automate, such as Robotic Process Automation (RPA) and AI Builder. An excellent example of an advanced use case is presented in this Microsoft Case Study where Coca-Cola entirely automated a manual and complex business process using Power Automate, RPA and AI Builder, avoiding having to hire 10 new full-time employees for mundane data processes tasks.
The potential for empowering your people to do more with less using Power Automate is huge, but sometimes it is hard to know how to get started. Rest assured there are numerous opportunities in every organisation for improvement through automation. Here are some tips to help identified where those opportunities lie in your business.
Check out all the Power Automate Connectors that are available, looking for any apps that you already use in your business processes. Click on each connector for inspiration from the templates and examples provided.
Consider any repetitive, data-entry style tasks you may have. Do you often have to re-key data from one system into another? These tasks make great candidates for automation.
Do you have any frequent but complex, multi-step processes that are well documented? Automation can be ideal for streamlining these.
The good news is that because Power Automate is a no-code platform, you don’t need to be a coding wizard yourself to get started streamlining workflows. Of course for more advanced applications you can always reach out to the Power Automate experts at Grassroots IT for help.
The Microsoft Power Platform is the collective term for four Microsoft products: Power BI, Power Apps, Power Automate and Power Virtual Agents. More than the sum of its parts, the Power Platform is a no-code to low-code platform that users with no coding experience can use to analyse data, build solutions, automate processes and engage online.
Although perfectly at home integrating with third-party apps, the Power Platform truly shines when used with your Microsoft 365 subscription, and being a low to no code platform means it can be used without the need to rely heavily on IT or coding experts.
Power BI is a cloud-based data analytics and visualisation tool used to bring together data from a wide range of sources to provide business intelligence and insight beyond merely data reporting.
Power BI allows users to create a visualized view of data to deliver easily digestible reports and dashboards, bringing a whole new experience to data reporting of complex analytics. Powerful API capabilities are available in Power BI, enabling integration with a vast array of applications and data sources.
One of the most compelling benefits of Power BI is the ability to combine multiple data sources into a single dashboard. For example, you could combine client demographic information from your marketing platform (eg: Mailchimp or HubSpot) with financial information from your accounting system (eg: Xero) and plot the resulting information on a map of Australia, offering new insight into where your most engaged and profitable clients are located.
The Power Apps platform enables no-code creation of desktop and mobile applications by both developers and non-developers alike. This enables your business to creatively build powerful applications to solve everyday challenges without the need for heavy coding skills.
Even though Power Apps runs on a simple drag-and-drop interface to allow for low-coding app development, more advanced features and capabilities are available for more experienced app developers to utilise. Power App capabilities can be further extended with Microsoft Power Automate and Azure Functions and the ability to connect to third party connectors and integrated apps.
Formerly known as Microsoft Flow, Power Automate lets you create an automated environment with workflows so you can have a faster way of tackling daily tasks that you would have otherwise handled manually. No heavy coding skills are required. You can choose from a set of pre-defined templates to start your automated workflow but, if you’d like to start from scratch, you can do that too.
The simple drag-and-drop interface allows for an easy build of automated workflows that work by customising desired triggers and subsequent actions (e.g. emails, push notifications, chat alerts, etc) to follow.
This means less time, effort and resources being spent on repeat manual processes that can be automated, as well as reducing the risk for human error in these processes. If you have two or more existing applications that require manual human involvement to share information and activities, Power Automate can automate that for you.
Related: 3 Short Automation Case Studies to Inspire Your Thinking
Power Virtual Agents is a bot building service for businesses that allows for no-code automated chat bot agents. With its drag-and-drop GUI, users can build the entire chatbot development cycle and integrate with chat channels like Teams and automated workflows from Power Automate to trigger job completions.
Power Virtual Agent chat bots can be used in a range of situations such as responding to client queries on your website or providing information and guidance to staff on an internal platform.
What applications can integrate with Power Platform?
There are quite literally hundreds of applications and data sources that the Power Platform can integrate with. As part of the Microsoft ecosystem, extensive integration is available with other Microsoft apps, as well as those in the Microsoft 365 suite, such as SharePoint and Teams.
Numerous third-party app integrations are available, including Salesforce, Dropbox, Xero and Slack. For apps without any native integration with the Power Platform, custom APIs, data gateways and robotic automation provide powerful connectivity options for almost any situation.
Pricing for the various Power Platform apps and features can vary depending on the Microsoft 365 plan that you already have in place, and which specific Power Platform elements you need. For example, Power Automate is included at no extra charge with many Microsoft 365 plans, however this free version may not have the ability to use what are called ‘Premium Connectors’ without adding on a paid license.
When developing a Power Platform solution, it’s important to consider what the ongoing licensing costs are likely to be. In some cases, it may be possible to create your solution on free, or cheaper licenses, however this does need to be considered during the development process.
Although each of the four products included in the Microsoft Power Platform serves a different purpose, they truly shine when used together across multiple business processes.
You can take advantage of Power Apps to build simple business applications, harness the benefits of automated processes with Power Automate, analyse your data in an easily digestible way with Power BI and engage with your community using automated chatbots with Power Virtual Agents – all without the need for heavy coding or software development skills.
If you would like help bringing a Power Platform solution to life, contact us today.